

Data Matching Evaluation
Statistically rigourous evaluation of data matching accuracy.
Measurement is essential for understanding and improving data matching accuracy.
Data matching is error prone. But data matching accuracy is rarely measured in current data integration systems. This is a major concern because measurement is essential for both understanding the current data matching accuracy and providing a basis for improving data matching accuracy.
With data matching we are concerned with two kinds of errors:
- False positives: When two records correspond to different entities, but the matching system claims they are a match.
- False negatives: When two records correspond to the same entity, but the matching system claims they are not a match.
Understanding the rates and impacts of false positives and false negatives arise in many professional disciplines.
- In medicine, doctors are aware of the rates and consequences of diagnostic tests returning false positive or false negative results compared to a patient's condition. Both errors are serious:
- a false negative is potentially life threatening if a patient is not given a treatment they require.
- a false positive is a wasteful delivery of treatment to a patient who does not need it.
- In law, when a witness is giving testimony, they swear an oath to tell the truth, the whole truth and nothing but the truth. In this case, the witness is making claims which are being compared against what actually happened: the whole truth equates to no false negatives - no truthful information is withheld; nothing but the truth equates to no false positives - no false information stated as testimony. Again both errors are have serious consequences for the integrity of the judicial system, and the offence of perjury for committing either error has very high penalties.
The sad fact is that data matching accuracy is rarely measured in current data integration systems, which means that an important data quality issue for these systems is going unnoticed.
In the sections below we describe the statistical basis for measuring record matching, and a methodology for evaluating the accuracy.
With record matching accuracy we are concerned with the false positive and false negative errors arising from classifying two records as matching or not.
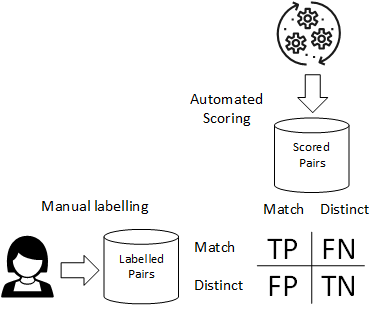
In order to measure the accuracy of an automated record matching system, we will need to establish a reference evaluation set of record pairs that have been labelled as 'match' or 'distinct'. This labelling will typically be carried out by a human expert or 'oracle' and will be subject to a review process to ensure that labelling errors are minimised.
The counts for true and false positives and true and false negatives for the evaluation set are obtained by categorising the labelling of the evaluation record pairs against the match/distinct classification of the automated record matching system.
Building the Evaluation Set
Establishing an evaluation data set for record matching is a hard problem because of the extreme imbalance between the number of matched and non-matched records. This can lead to the requirement for either a very large evaluation data set, or poor accuracy in the evaluation results. Recent academic research on the topic of importance sampling for creating an evaluation data set has provided a statistically rigorous way of obtaining accurate evaluation results without requiring a very large evaluation data set.
With the importance sampling approach, the full set of scored pairs for a training run are sorted into strata based on their score. The strata for low scored pairs are very large, but the strata for high scored pairs are very small. With importance sampling, evaluation pairs are selected from the high scored strata at a much higher rate than the low scored strata, resulting in an evaluation set that is much more balanced than the original scored pairs. Once the evaluation set has been selected, a human expert is required to label the evaluation set, so that a comparison can be made between the machine scoring and the human labelling. Importance sampling then applies a correction factor to the calculation of precision and recall that compensates for this evaluation sampling bias to give a final set of results that are accurate for the scored data.
Labelled Pairs Distribution
The record count distribution of labelled pairs of the evaluation set against their score calculated by the record matching system can be displayed as a histogram.
For a good matching algorithm, the expected shape of the histogram is a 'bathtub shape', with high record counts for low scored distinct pairs and high scored match pairs at either end of the histogram.
In the distribution histogram below, the scored pairs scores have been divided into 20 quantiles, from 0 to 0.95. The bars are coloured according to the evaluation set labelling. The graph shows very high record counts for low scored distinct pairs and high scored match pairs. Note that the vertical axis is a logarithmic scale, which obscures the bathtub shape implied by the results.
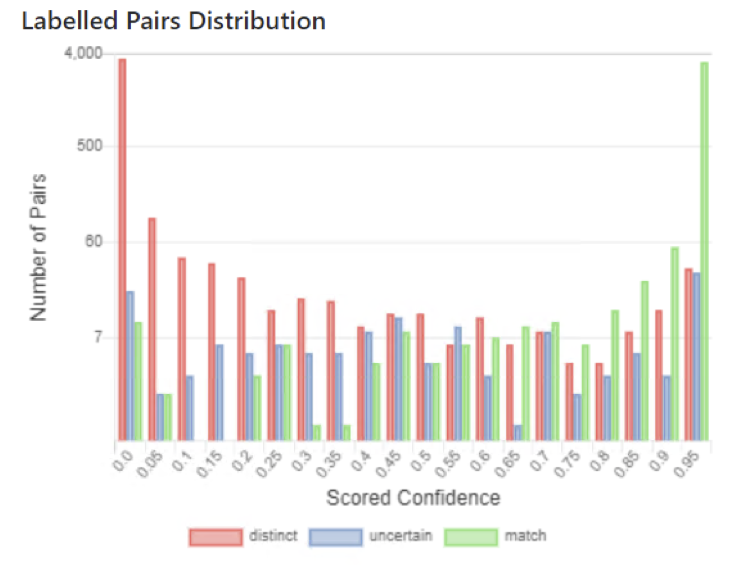
The graph shows that there are a relative low numbers of errors:
- Possible false positives appear as low scored match pairs (green)
- Possible false negatives appear as high scored distinct pairs (red)
Precision and Recall
The concepts of Precision and Recall provide a measure of the relative error rates for false positives and false negatives, respectively. Precision and Recall give a numerical measure in the range from 0 to 1.
The mathematical definition of these terms are as follows:
\[ Precision = \frac{TruePositive}{TruePositive + FalsePositive} \]
\[ Recall = \frac{TruePositive}{TruePositive + FalseNegative} \]
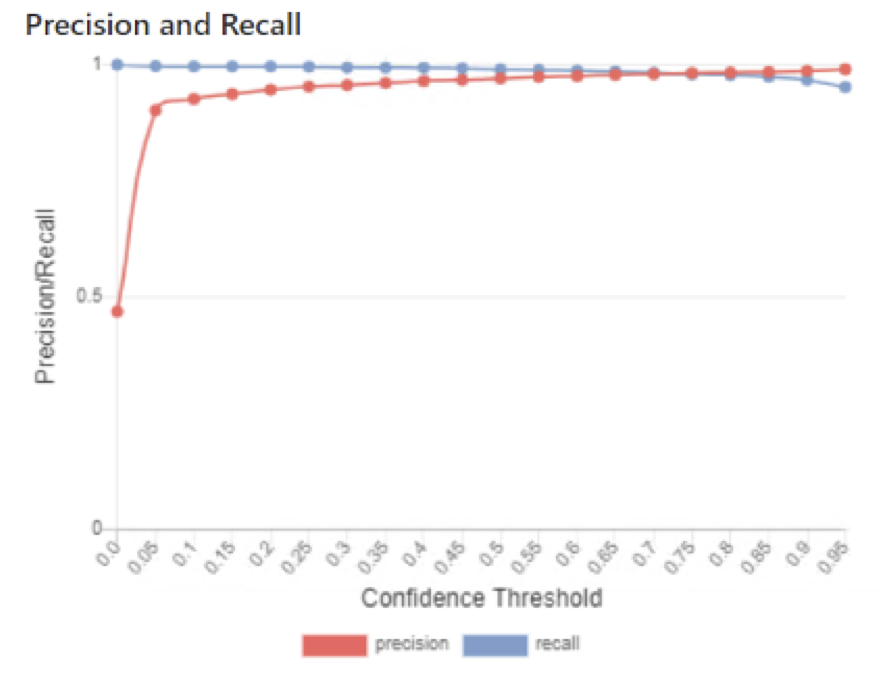
One of the design features of a scoring-based record matching system is that a scoring threshold is applied to classify the scored pair as either matched or distinct. In theory the threshold can be set at any value between 0 and 1. Across this range, there is a trade-off between precision and recall. If the threshold is low, the number of false negatives will be low (high recall, few missed matches) but the number of false positives will be high (low precision). If the threshold is high, the number of false negatives will be high (low recall, more missed matches) but the number of false positives will be low (high precision).
The trade-off between precision and recall can be readily seen in the Precision/Recall graph which charts precision and recall against a threshold value.
A typical Precision/Recall graph is shown below.
F-score and determining the optimal threshold
The measures of precision and recall can be combined to a single value called an F-score. An F-score is the harmonic mean of the precision and recall.
The F-score can be biased towards either precision or recall using a factor called the F-score beta. For a balanced F-score the beta is 1. For an F-score biased towards recall, the beta is greater than one, while for an F-score biased towards precision, the beta is less than one.
The formula the F-score with a beta of 1 is:
\[ \mathit{\text{F-score}} = 2 \cdot \frac{ Precision \cdot Recall }{ Precision + Recall } \]
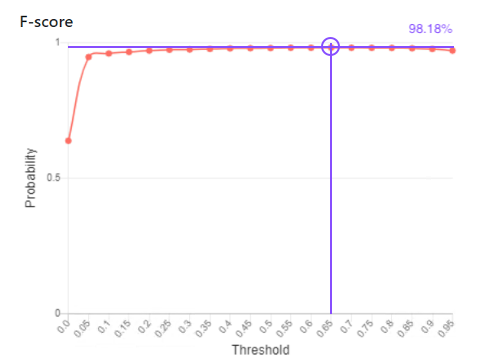
F-score gives us a single figure measure for record matching accuracy that combines the measures of both precision and recall. Hence it takes into consideration both false positive and false negative errors. We can use the threshold that maximises the f-score as the optimal threshold for record matching classification.
In the graph below we show that a threshold of 0.65 gives a maximum f-score of 98.18%.
Entity resolution and 360° view of customer or citizen
To learn about accurate entity resolution and integration into current Master Data Management solutions.
Learn More